Graph Package
- 30 Apr 2025
- 1 Minute to read
- Contributors

- Print
- PDF
Graph Package
- Updated on 30 Apr 2025
- 1 Minute to read
- Contributors
- Print
- PDF
Article summary
Did you find this summary helpful?
Thank you for your feedback
Introduction
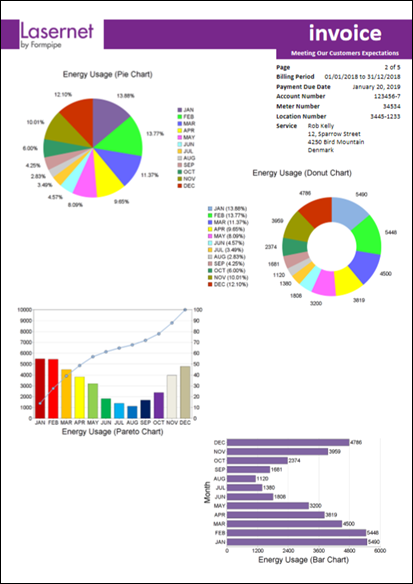
The Graph package is an easy way to graphically represent your data and can be used to ease the understanding of large quantities of data and the relationships between the constituent parts.
The following chart types are available for EMF and PDF output formats:
Area
Bar
Donut
Line
Pareto
Pie
Spline
Stacked Bar
StepLine
Trend
Bar Line
Graphs added to classic forms in the EMF and PDF output formats, requires a Graph module license.
Charts are also available in Word Out to create DOCX as output format.
The following chart types are available for DOCX output format:
Bar
Point
Bubble
Line
Area
Range
Pie
Donut
Funnel
Radar
Polar
Financial
Gantt
Box Plot
Note
Word Out does not require an additional Graph package license; charts are already included.
(37).png)
Dependencies
Lasernet Base Server Package incl. XML in & out
Word Out