Performance
- 03 Mar 2026
- 2 Minutes to read
- Contributors

- Print
- PDF
Performance
- Updated on 03 Mar 2026
- 2 Minutes to read
- Contributors
- Print
- PDF
Article summary
Did you find this summary helpful?
Thank you for your feedback
Performance Indicators
Lasernet FO Connector provides some out-of-the-box functionality to test the performance of reports when they are run: the Performance indicators, which do not require a Test and Performance Suite license. However, the Test and Performance Suite contains far superior capabilities when conducting performance testing. The Test and Performance Suite also provides functionality for regression testing following an upgrade, in addition to tools for creating data.
The performance of reports is measured by activating the Performance indicators in the Lasernet Parameters form. This can be achieved by following these steps:
Navigate to Lasernet > Setup > Parameters.
Open the Performance tab and set the Performance indicators field to Full.
You will also need to enter a User ID. This will be the only user who can see the Performance indicators when running a Lasernet report.
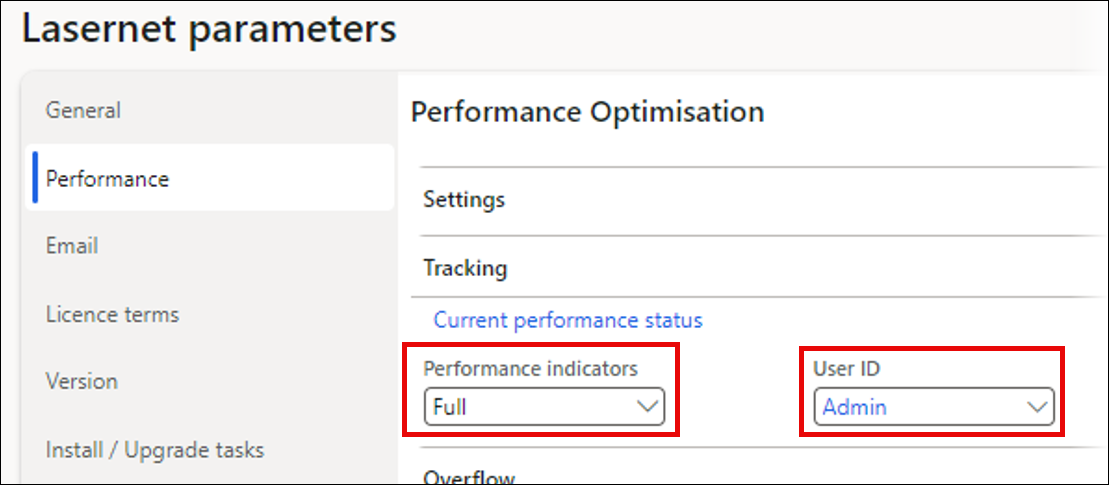
Setting the Performance indicators to Full enables you to add a query statement (SQL statement) to the Infolog once a report is executed. This provides useful information, such as the time taken to retrieve the data for the different parts of the query.
(20).png)
Setting the Performance indicators to Simple displays performance information when a report is run but does not provide as much detail as setting them to Full.
Performance Overview
The Test and Performance Suite provides functionality to test the performance of reports that are processed by Lasernet FO connector. This functionality is beneficial to an organization, as it can be used to test the throughput of reports. For example, an organization may have a requirement to generate 1,000 sales invoices and email each one to a different customer within one hour. The Test and Performance Suite can be used to test this requirement.
The Test and Performance Suite can be used to improve processing times and throughput by identifying the best settings. This is achieved by testing various scenarios and logging information when a performance test is done, so the results can be compared.
The following information is logged to identify the best settings:
The average execution time per report
The average execution time per report (including the time used for the batch task)
Memory usage (%) per report
CPU usage (%) per report
Performance tests with the Test and Performance Suite typically use different numbers of reports. For example, a performance test may be performed with 10 / 100 / 1,000 reports within a batch job. It is important to test different numbers of reports, as the best settings may differ depending on the number of reports that need to be generated.
Batch jobs can be used for performance testing. A batch job can be used with one of two different parallelism strategies to process the data in multiple batch servers and threads:
Top Picking
Batch Bundling
Each approach has its advantages and disadvantages. However, finding the right approach can sometimes drastically improve the performance, which is particularly important when a certain number of reports needed to be generated within a limited time frame. The following article can be used to learn more about the two approaches: Batch parallelism/multithreading in Dynamics 365 for Finance and Operations (D365FO).
This video can be used to get a brief overview of the Performance functionality in the Test and Performance Suite.