DOCX Outputs (Charts)
- 06 Mar 2026
- 1 Minute to read
- Contributors


- Print
- PDF
DOCX Outputs (Charts)
- Updated on 06 Mar 2026
- 1 Minute to read
- Contributors
- Print
- PDF
Article summary
Did you find this summary helpful?
Thank you for your feedback
Applies to: Lasernet 9
In this exercise, you can learn how to insert a chart in the DOCX output as well as how to edit the inserted chart.
Note
This article describes a software version that is no longer supported. Although the software will no longer receive updates or technical support, existing documentation, such as this article, will be retained for reference purposes but will no longer be updated. If you have any questions, contact Lasernet Support.
Exercise
Download and import the attached configuration called 06. DOCX Output (Charts) in Lasernet Developer 9. Afterward, go to the Forms section and open the Sample form.
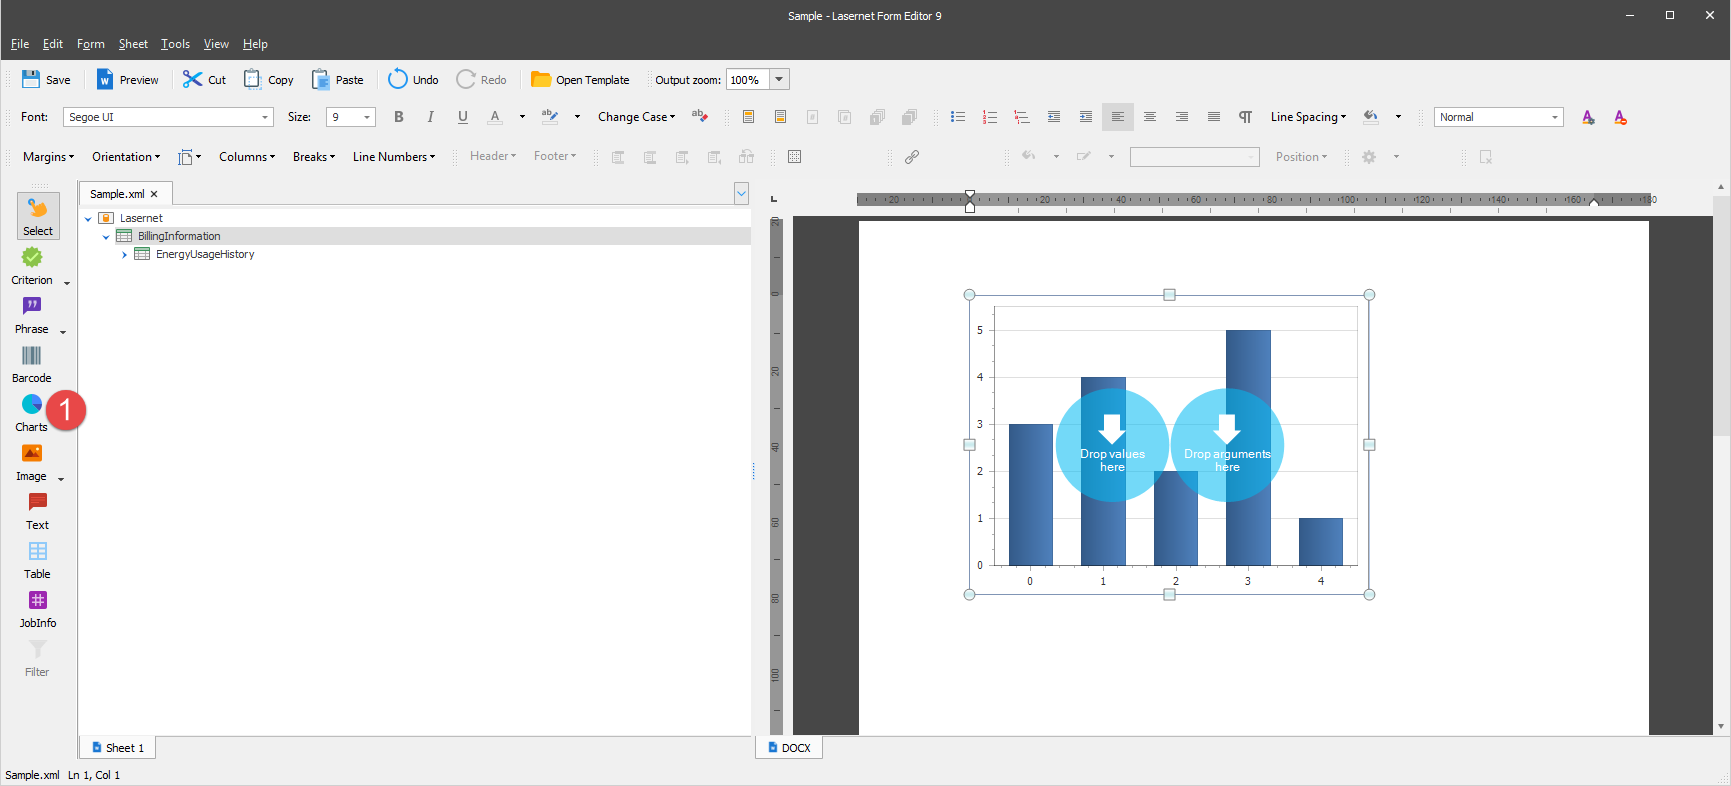
Start by adding a chart to the output. To this end, click Chart on the Developer toolbar. A chart will be inserted into your output.
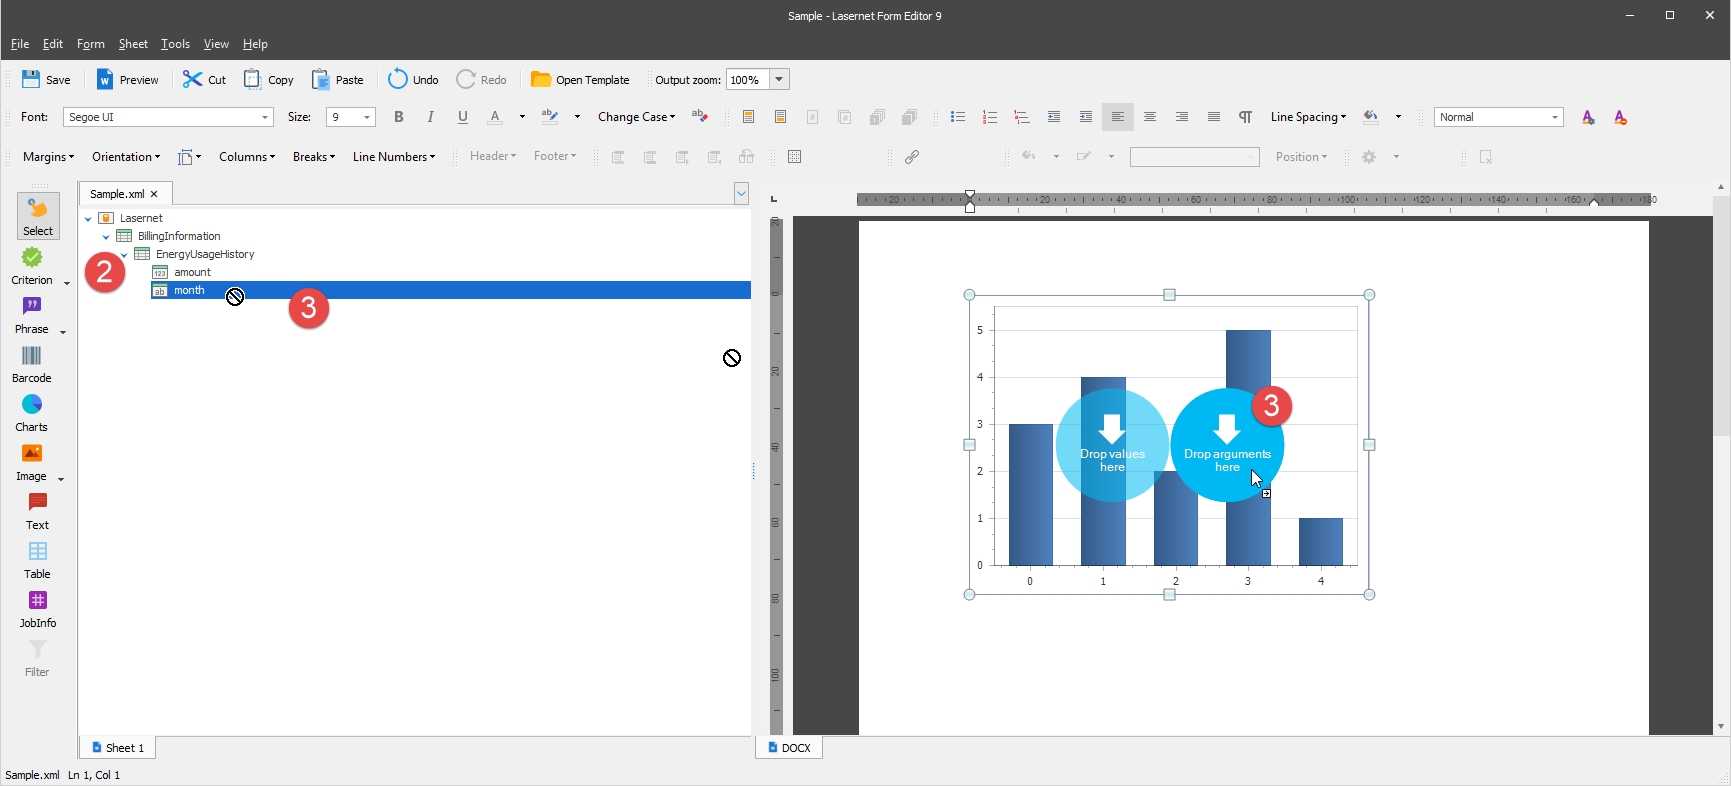
Expand the EnergyUsageHistory node to display its detail view.
Once you are done, drag the month item from the input to the <arguments> circle of the chart in the output.
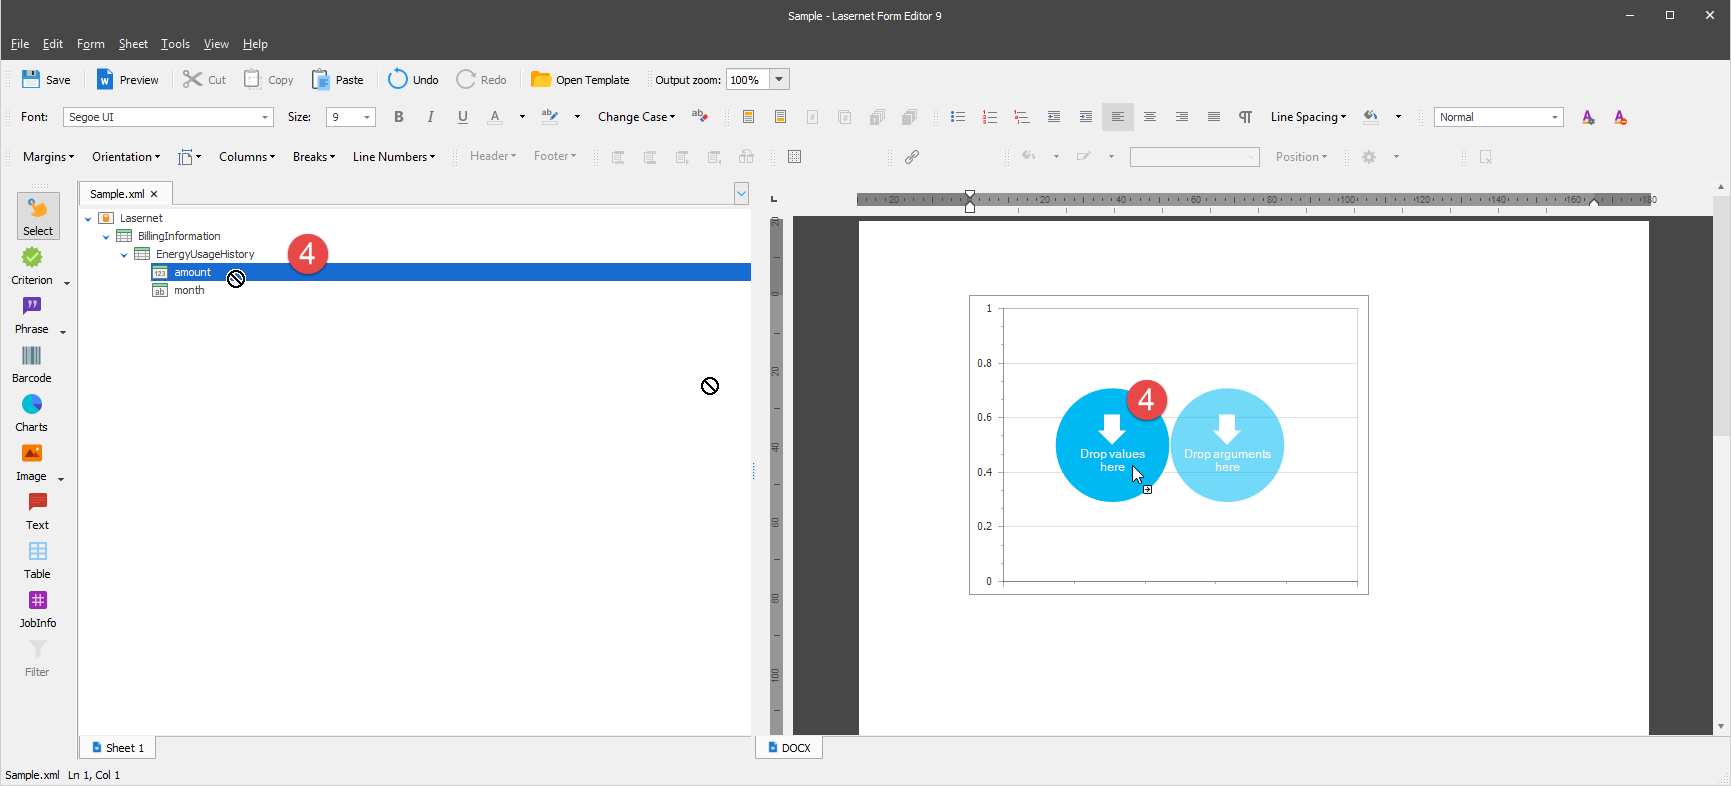
Afterward, drag the amount item from the input to the <values> circle of the chart in the output.
You are now proposed to change the chart settings. To this end, follow these steps.
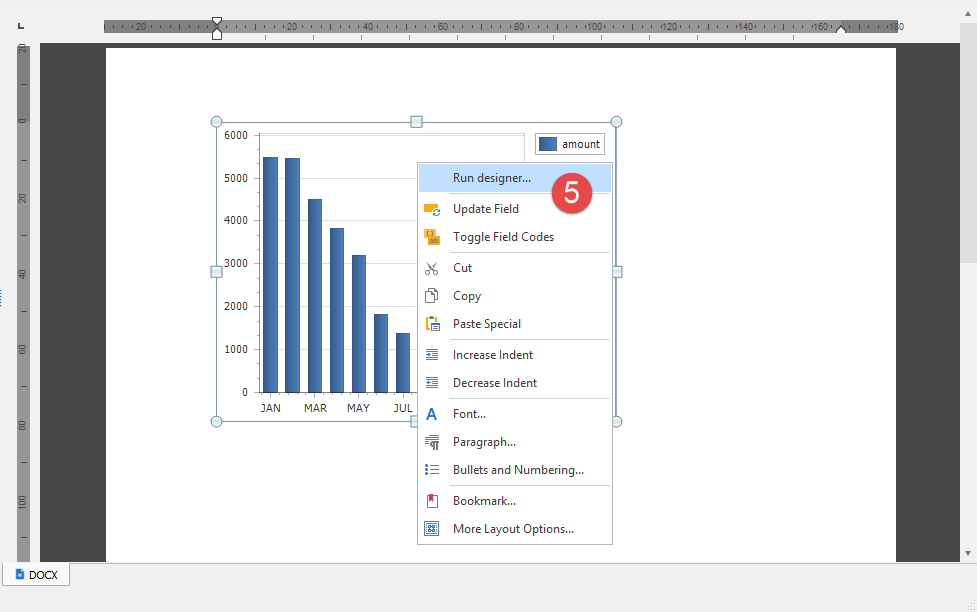
Right-click the chart, and then click Run designer... on the context menu that appears.
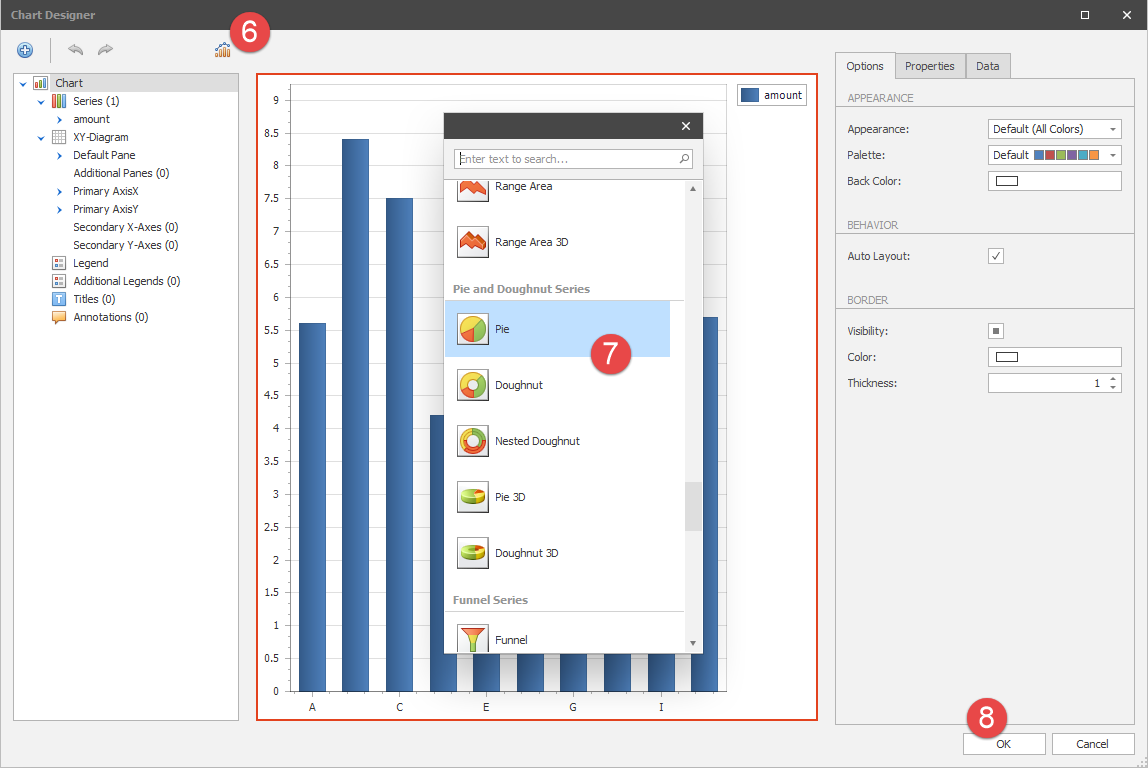
In the Chart Designer window displayed, click the Change Chart Type button.
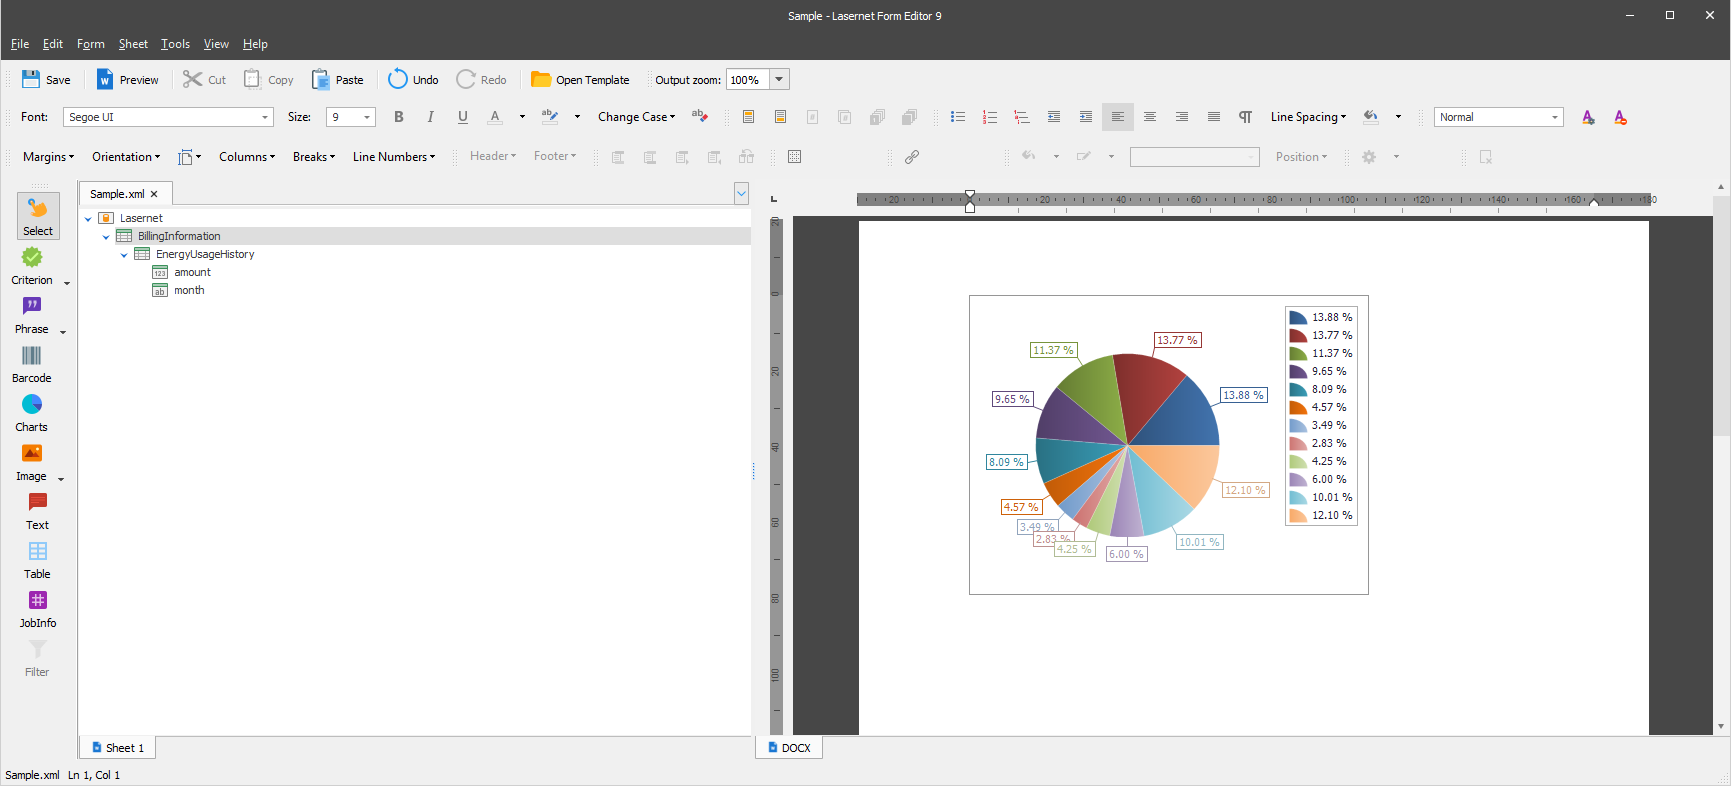
Select Pie from the list.
Click OK to confirm changes.
As a result, the chart type has been changed: