- Print
- PDF
Lasernet provides built-in tools in order to create tables. How to use these tools is detailed in the standard manuals that are installed with the product such as the Form Editor manual.
Lasernet 9 or Newer
Apply Alternating Row Shading
Row shading can be applied to a pre-existing table by performing the following steps:
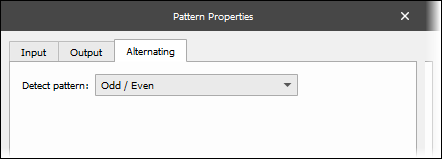
Select the pattern and set it to Odd/Even under the Alternating tab.
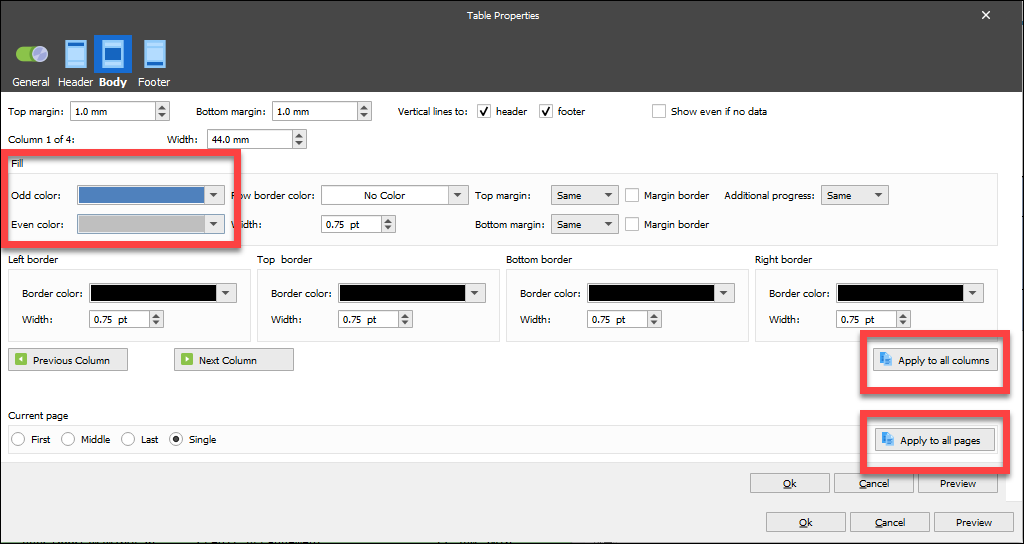
Open the Table Properties and select the Body tab.
Select the Odd and Even colours needed for each row, click the Apply to all columns button and the Apply to all pages button to apply to all columns and all pages.
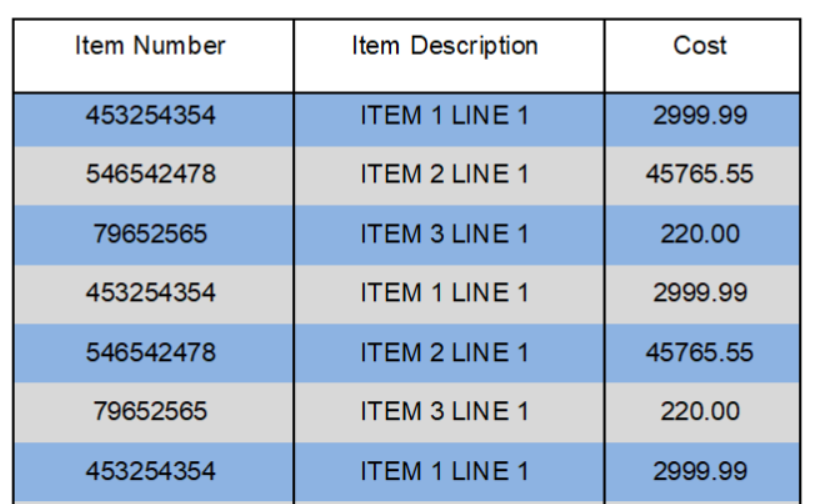
The following is the result:
Lasernet 7 or Newer
Apply Alternating Row Shading via Scripts
The following image is a table designed in Lasernet using a shading row script:

This will use shapes, regions, and scripts.
Add the following function to a script:
{
logger.logEvent(5000, "obj = " + obj);
logger.logEvent(5000, "fillColour = " + fillColour);
logger.logEvent(5000, "lineColour = " + lineColour);
logger.logEvent(5000, "Current Line = " + Line);
if (Line % 2 === 0)
{
logger.logEvent(5000, "**EVEN ROW IDENTIFIED**");
logger.logEvent(5000, "Applying row shading: ");
obj[Line].backgroundColor = "0x" + fillColour;
if (lineColour != "")
{
obj[Line].color = "0x" + lineColour;
}
}
else
{
logger.logEvent(5000, "**ODD ROW IDENTIFIED**");
}
}
Create a Region in which the table data will output and then create a pattern to capture the data to be displayed in a table.
Configure the pattern to output in the newly created region and arrange the data on the output pane so that the columns are in the required order and the text aligned as desired.
Edit the Properties
Use the Shapes tool to create a rectangle.
Instead of drawing the rectangle on the output pane, click one of the lines of the pattern on the input pane. A rectangle should be created for each line in the pattern.
Edit the properties of the rectangle and go to the Output tab.
Adjust the size and position so that the rectangles line up exactly with each row and extend the full width of the table. The height of a line is usually 5mm.
Change the Fill Color to the color for the odd rows (for instance, 1,3,5,7, etc) to appear.
Change the Line Color to the color required for the table to appear.
Set the Object Name (for example, table1) at the top of the window and click OK.
The rows of the table are now shaded in the same color.
Edit the properties of the rectangle and click the Input tab.
Select the Script > Active box so that a script can be run against this object.
The Script Box
In the script box, call the script applyRowShading().
The script accepts parameters for Object Name, Fill Color, and Line Colour.
Object Name: the name of the rectangle that was set earlier, in this case, table1.
Fill Color: this must be a hexadecimal representation of the color to use as the background for even rows (2,4,6,8 etc.). For example, FEF6FA.
Line Color: this must be a hexadecimal representation of the color selected as the line color for rectangles earlier. For example, FFFFFF.
In this example, we would write, in the script box, applyRowShading(table1, FEF6FA, FFFFFF);
Click Ok.
Now run the scripts on the page. The rows should alternate in color.
Ensure the Header Values Remain on Every Page
Tables can be applied to a Conditional Area or a Region. The advantage of using a region is that the table title can stay at the top of the table without being affected by other content on either side of it.
In this example, we will apply a header to a table that spans multiple pages. We first need to create a region:
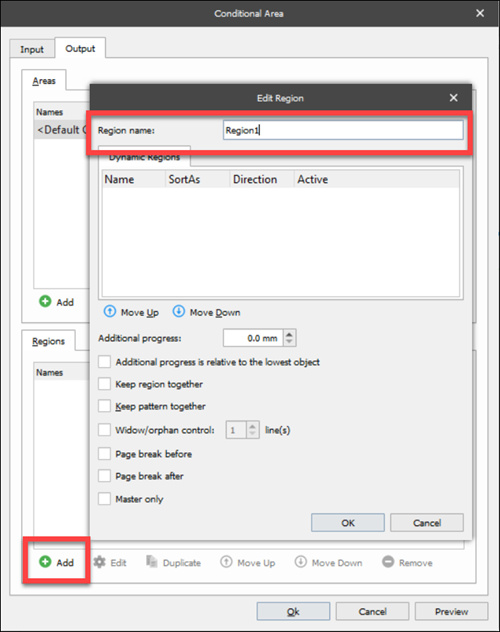
Right-click the Output area, select Conditional Area from the list, and under the Regions tab, click Add.
Create a Region and ensure the pattern is set to output to the region.
Click the Table option in the left toolbar and select Apply to Region.

This table has a header at the start, but so far, there is no header on the next page.

Double-click a title to display the Edit Rearrange window and select the Position tab.
In the Relative section, set the following from two of the drop-down options:
Relative to: Top of region
Region: The region you had created previously
Select the All pages checkbox.
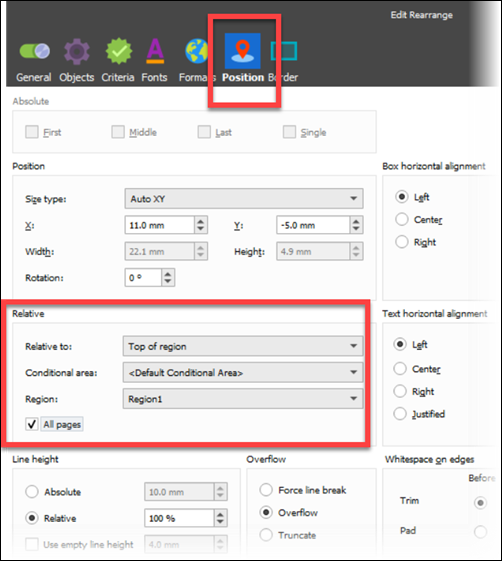
The title will now be set at the top of each page for that region:

This can be completed by doing the same to the other titles and by adding some shapes to add the table box. The shapes will need the same position settings as the previous step.

Add a New Column via the Table Tool
In this example, some new data has been added that needs to be included in the table.
Position the mouse pointer over the column line, right-click, and select Insert Column.
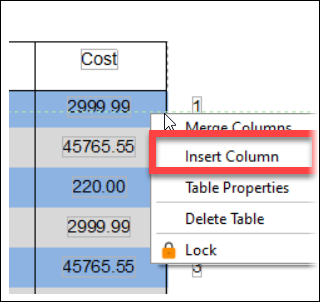
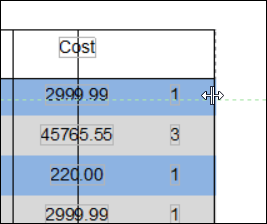
Drag the column across to cover the new data.
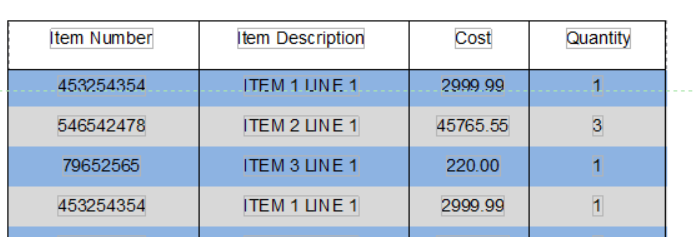
Now the table has an extra column:
Merge Columns via the Table Tool
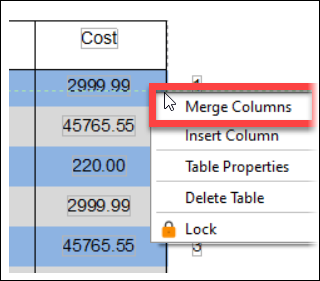
To use the Merge Column option to merge two columns together, right-click the shared edge between two columns and click Merge Columns.
Adjust the Column Dividing Line via the Table Tool
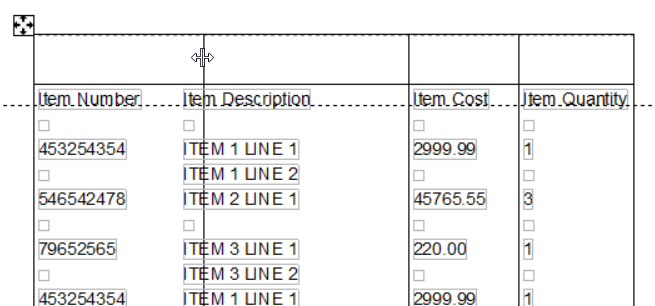
With the table set up, the column dividers can be adjusted to match the data by clicking on the line and moving it.
The color/width of each column line can be adjusted. To do this, follow these steps:
Right-click the table to display the Table Properties window and select the Body tab.
Column 1 of 4 is displayed in the following example.
To choose the required column, select either the Previous Column or the Next Column buttons.
The settings can be applied to all columns by using the Apply to all columns button.
Select the required width by entering a value in the Width field.
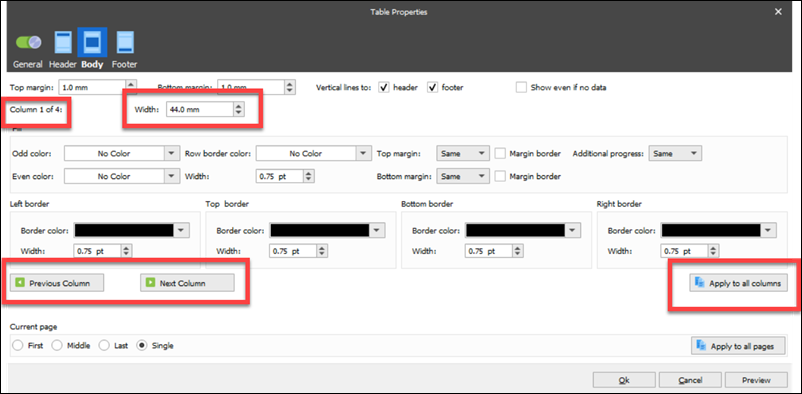
Use the Fill section to determine the line colors of borders, and then click Ok.

